
Cluster Home
ESA Science Home
![]()
 |
||||
|
CSDS Home Cluster Home ESA Science Home |
Science Data System |
|
||
This option allows users to overplot data from different spacecraft on the same panel. The parameters are colour coded according to the spacecraft number. This ability to overplot data makes inter-comparison of the four spacecraft data much more straightforward. To use this facility follow the normal process of selecting files and variables for the parameters that you want to plot. You will find a new checkbox labeled "Overplot PP" to the right of the Start/Stop inputs. Click on this checkbox to select overplot mode. You will also find a similar control on the plot page which allows you to switch between overplot and normal modes when using the zoom function.
Note: Due to the limited resolution of the quicklook plots, the overplotting function is really only useful for short time periods (something like an hour or less). For this reason the option is switched off by default. If you encounter problems when generating a combined plot, try turning off the overplotting to determine the spacecraft or parameter that is causing the problem. Modify the plot selection to exclude these and then try again.
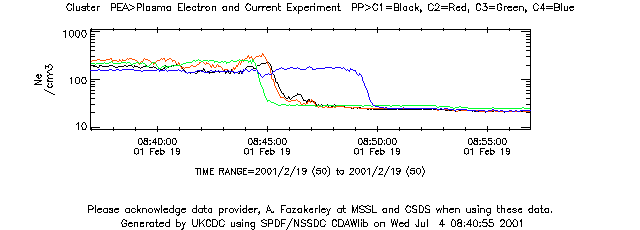
Example showing PEACE electron density from all four spacecraft during a Bow shock crossing on the 19th Feb 01, here we see that spacecraft 4 (blue) enters the solar wind about five minutes later than the other three spacecraft.
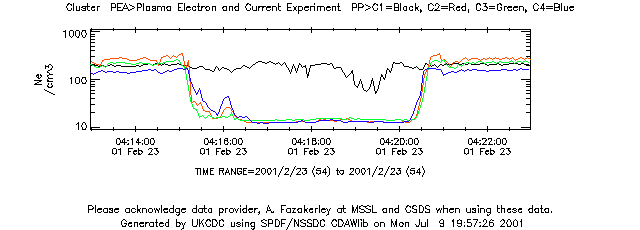
Here is another Bow shock example from PEACE, in this case three of the spacecraft (2, 3 and 4) enter the solar wind for a short period while spacecraft 1 remains in the higher density magneotsheath region.
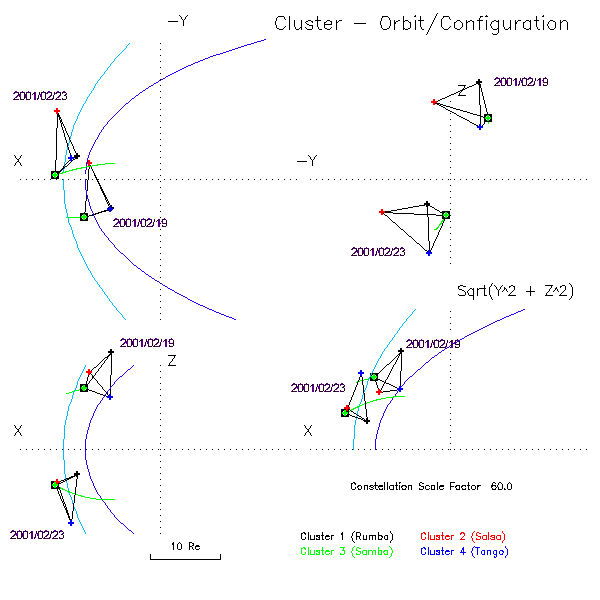
The spacecraft configuration during these events is shown in the figure below. Pre-rendered versions of these Orbit/Configuration plots are avaialable from CSDSweb.
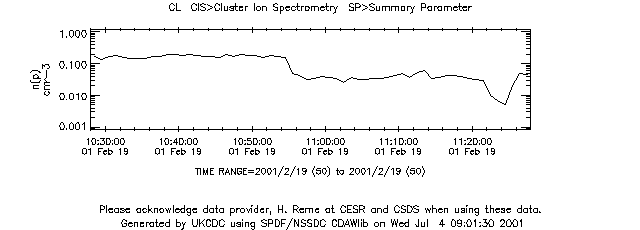
The ability to change the time range of a plot simply by clicking inside any of the time series plot windows has been added. A pull down menu at the top of the screen allows selection of several different zoom factors and fixed time intervals. The plot will be re-centred based on where you click on the plot. In the following example we start with a plot of CIS ion density.
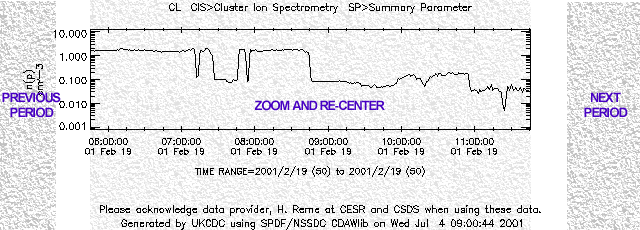
By selecting a time interval of "1 Hour" and clicking on the density drop just before 11:00, a new plot is automatically generated.
Clicking near the right edge of the plot (the region to the right of the axis) will cause the next period of data to be plotted. Clicking to the left of the leftmost axis label will similarly show the previous period of data. Note that this may move you outside the time range covered by the selected files in which case you should use the auto file select mode described above. If the period that you have requested does not contain data then the normal plot will be replaced by the current time period and a picture showing a pair of directional arrows. By clicking on the arrows you can request the adjacent periods.

In the case of multiple plots per page, any can be used to select the new centre time and all are regenerated using the new time range. A useful "LISTING" button has also been added which will generate a text listing of the current plot parameters for the current time range.
At the bottom of the zoom time range list there is now an option called "Show Time". When this option is selected, instead of the plot being regenerated a small browser window is opened that displays the time corresponding to where the mouse was clicked in the plot. [Note: Javascript is used to open the new window so this must be enabled for this function to work.]
At the moment only the time is displayed, in future additional information may be added or even a plot showing the constellation configuration at that time. The time format is compatible with Excel so you can select the time string and drag it directly on to a cell in a spreadsheet.
If you use the CDMS file selection option to pick the data files that are to be used for plotting then ONLY these files get used. If you zoom or change the time range you can select a period that is partly or completely outside the coverage of the selected files. To overcome this problem you can enable the auto file selection option. When this is active the list of files that have been selected is ignored and the database is searched for the most recent version of files that contain data within the requested plot interval. You can switch between selected and automatic file modes using the checkbox and then pressing the Plot button to regenerate the output.
The Save Config button is found to the right of the Plot and Listing buttons. It will generate a small html file that contains the current settings (time range, plot parameters and file selection) but does not contain any plots. Using the Save as function on a web browser this file can be saved on a local machine. The file can be reloaded at a later time.
Caveats are important information that the PI teams add to the data files as part of a validation process prior to release to the data centres. They include status of the instrument and any particular quality concerns. Users are strongly recommended to review the caveats before working with the data. To simplify access to this information an option has been added that will allow the caveats information to be displayed when generating a plot or listing via the web system. For example:-
CL_SP_CIS_20010218_V02.cdf Caveats:
         Insufficient CODIF counting statistics when density (Low-g) < 1.0000e-03 (1 times, first at 2001-02-18T22:00:30Z)
        Preliminary Calibration Values.
        Incorrect CODIF Temperature Values.
        No HIA data during Eclipse.
Active links to CSDSweb and the NASA SSC page have been added to the plot page. These will appear in a browser window identified by Target=NEW_PAGE. In the case of the CSDSweb plot the nearest 6 hour overview plot to the centre of the selected time range will be displayed. For SSC web the four Cluster spacecraft will be preselected and the time range will be set to the time range of the current plot.
A database contents page is now accessible from the home page of this site. The software used to generate the database contents page runs directly from the catalogues and generates the output on-the-fly. This provides a quick view of the contents of the database to allow users to check if data has been processed from a particular day of interest. Links to the left of the page will take the user to the corresponding data request page and automatically set the date of the request.
Thanks to Chris Perry at the UK Data Centre for much of the work that went into the changes featured here.
New features in CDMS version 4.0